Diversification
– Weighted
Performance
Evaluation

Investors hold diversification, long a bedrock of investor prudence, in high esteem. This is curious, as diversification is both ubiquitous and misunderstood. Diversification is typically associated with asset allocation, but fundamentally, diversification is a weighting strategy. We have formalized diversification as a weighting approach.

DIVERSIFICATION– WEIGHTED PERFORMANCE EVALUATION

Investors hold diversification, long a bedrock of investor prudence, in high esteem. This is curious, as diversification is both ubiquitous and misunderstood. Diversification is typically associated with asset allocation, but fundamentally, diversification is a weighting strategy. We have formalized diversification as a weighting approach.
joi-header-img-xs

A new approach to building a portfolio

Using the components of the S&P 500 Index, we investigate an alternative, process-driven methodology for index construction and optimization called Diversification Weighting. We find that when reconstituting the S&P 500 universe from January 1996 through May 2014, using Diversification Optimization, we achieved annualized outperformance of 427 basis points against the capital-weighted benchmark, and achieved favorable results when compared against other weighted approaches applied to the same investments universe. We also introduce diversification measurement for the purpose of context and clarity underpinning Diversification Optimization.

2023 Update and Revision:

In May 2023, this research was updated through April 4th 2023.  We have left all of the text the same, including any references to performance in the text.  However, the majority of the charts and graphics have been updated. Notes on the update and revision are available on request.  This brings the analysis to 27 years and the performance of the Diversification Weighted Strategy outperforming the Capitalization weighted strategy by 3.83% per year, net estimated fees and expenses.


Overview

Investors hold diversification, long a bedrock of investor prudence, in high esteem. This is curious, as diversification is both ubiquitous and misunderstood. Diversification is typically associated with asset allocation, but fundamentally, diversification is a weighting strategy. We have formalized diversification as a weighting approach. We believe Diversification Weighting is both unique and often superior to conventional weighting approaches. Importantly, it is not constrained to a particular market, style or even asset class.

In addition, we show portfolio diversification to provide material performance improvements to both risk and return. Part of the attraction to smart-beta euphoria is an intuition that repeatable investment performance is systematic. Investors prefer a repeatable process and especially a process rooted in things that are rather simple and easily understood.

Diversification, as a concept, has been around for a long time, but only in vague or indefinite terms. This paper circumscribes various inventions for diversification measurement, visualization and optimization, but a full treatment of all of these topics is beyond the scope of this article. The question we mean to address here is, does diversification work?

In essence, diversification increases for every equally weighted, uncorrelated asset added to a portfolio. When we put the portfolio in a geometric space, such additions add a dimension, which may measure the diversification therein. When we weight assets in a manner consistent with maximizing the portfolio dimensionality, perhaps subject to a utility function, the portfolio is said to be diversification weighted.

Defining Diversification: The Framework
For Measurement And Optimization

ptt-joi-figure1
For something to be optimized, it must have a clear and definable objective function. Diversification, while ethereal by its nature, can be defined with precision and definiteness.

For readers interested in diversification or how the results are obtained, we need to set some foundations in the geometric modeling. The ensuing geometric modeling framework provides the background for both diversification measurement and optimization.

Asset correlations are measured and assets are projected to a space that maps the measured correlations to the angles separating one asset from another, so that assets with higher correlations have a more acute angle separating the vectors. Assets sharing zero correlation are mapped to a 90° angle and assets with a -1 correlation are mapped as diametric opposites having a 180° angle.

Imagine a three-asset portfolio; each asset has zero correlation to the other two assets. Each asset literally takes the portfolio in a new direction. Note that all available dimensions are used as degrees of freedom to convey the relativity of the assets. It is correlation in every dimension. We refer to this as having a relativity domain space. Imagine that we introduce a fourth uncorrelated asset. Where would it fit? It cannot fit in 3-D without creating some distortion. There is not enough dimensionality to hold it. We need to introduce an additional dimension, which may accurately represent the fourth uncorrelated asset.

In mathematics, there is no limit to dimensionality. So it is with portfolios. Diversification has no upper boundary; there can always be more. Any portfolio has an ambient dimensionality equal to the number of assets in it. The ambient dimension compacts to the spanning dimension after ringing out all of the redundant information caused by disparate weighting and positive correlations. The spanning dimension thus contains all of the portfolio’s information. It is a bit like a .jpeg at 100 percent quality. The dimension of the portfolio can be further reduced when associated with a confidence interval, such that it captures X percent of the portfolio. That dimensionality is called an “effective dimension.” It is like viewing a .jpeg at 90 percent quality; it captures the essence of the image, but does not require same amount of data. Thus, the lowest dimensions 1,2,3 … are the most pervasive and measure systematic diversification and risk exposure.

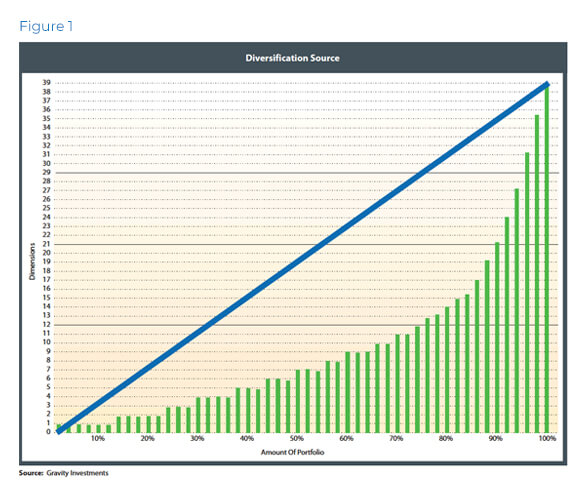
When we arrange the dimensions from the most pervasive or fundamental to the least, we can visualize the portfolio’s exposure across the dimensions. The vertical axis in Figure 1 gives the dimensions required to contain X percent of the portfolio.

This framework explains how portfolios sprawl across multiple dimensions. The primary dimensions give the systematic exposure on the left and it integrates with the idiosyncratic exposures on the right. Each new dimension acts as a source of diversification unto the portfolio. The blue shadow line gives the investor an understanding of what perfect diversification (given the investment quantity) would look like. The portfolio would mimic
this line if each asset were equally weighted and uncorrelated. The more exponential the portfolio graph, the greater the risk, as such exponential graphs are indicative of superficial diversification in asset quantity only.

We apply this diversification framework to weighted as well as unweighted portfolios. When the portfolio is already weighted, the framework gives the measurements of diversification as well as the visualization.

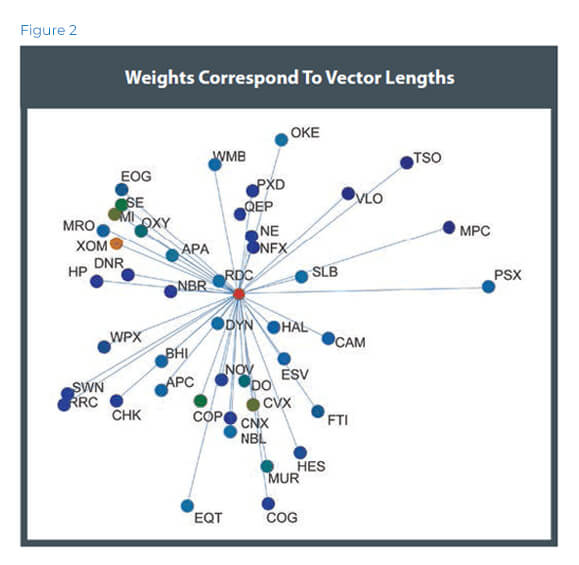
When the framework is applied to a weighted portfolio, the given weights for each asset are modeled as the vector lengths for each asset. Intuitively, the weight extends the assets in its given direction (Figure 2).

In essence, it is like a multidimensional pie chart containing relativity data.

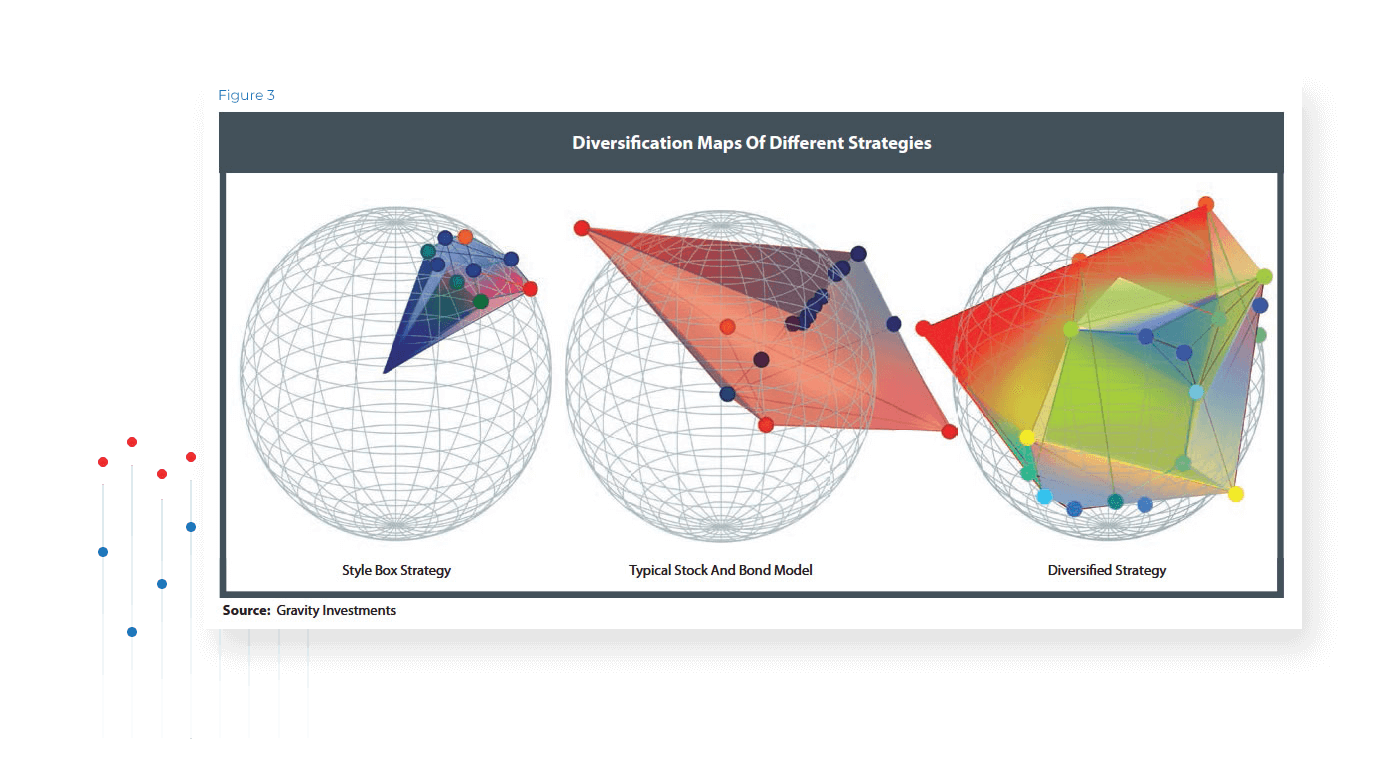
The resulting level of symmetry induced by the model structured by the assets’ weights and relationships provides a visual explanation of portfolio diversification. Portfolio balance is manifest as three-dimensional balance in the True Diversification model framework. True Diversification accounts for the diversification directly and captures both the systematic and nonsystematic perspectives (Figure 3). This process can be applied to any asset or any mix of assets, including disparate assets classes, or mixing of various instruments. We recycle this geometric modeling process to optimize diversification.

ptt-joi-figure2

Diversification Optimization:
The Theoretical Foundation

The following section explains the general approaches of Diversification Optimization. Diversification Optimization is built on the same geometric framework for diversification visualization and measurement. The crucial difference is that the length of each asset’s vector is not its current weight in the portfolio, but a utility function.
ptt-joi-figure3
The utility function is conventionally a risk-adjusted return. The utility function concept is very flexible; we have used metrics such as Sharpe ratios, Calmar ratios, total returns, fundamental scores, omega functions and alphas. Assets with superior performance have longer vectors, literally extending the portfolio in its given direction. The choice of a utility function measures the relative attractiveness of the assets.

The portfolio thus has two elementary inputs: the relationship of each asset to every other asset in the portfolio, as measured by its correlation matrix and modeled by the relative angles; and the utility function for every asset measuring the relative attractiveness of each asset and modeling the magnitude of each vector. These are the only inputted asset variables.

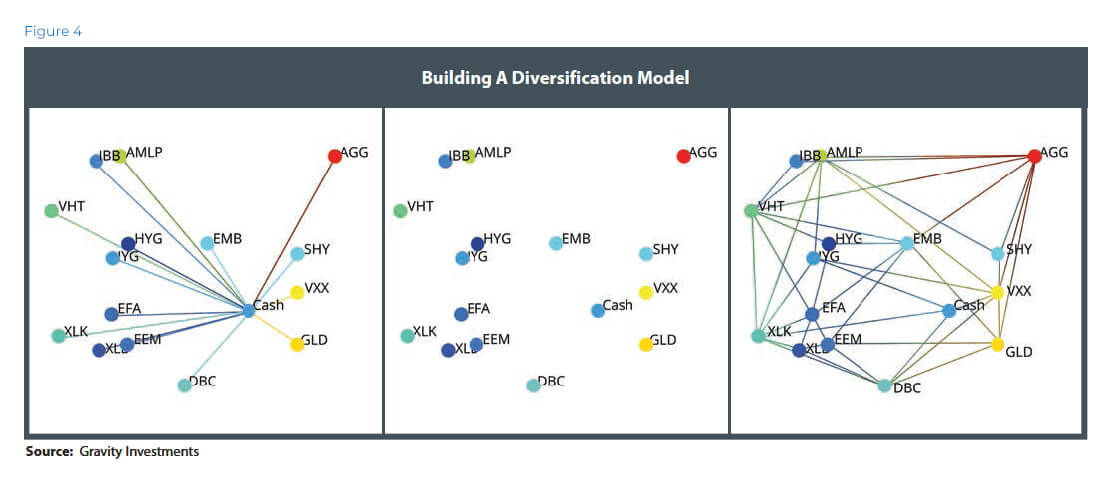
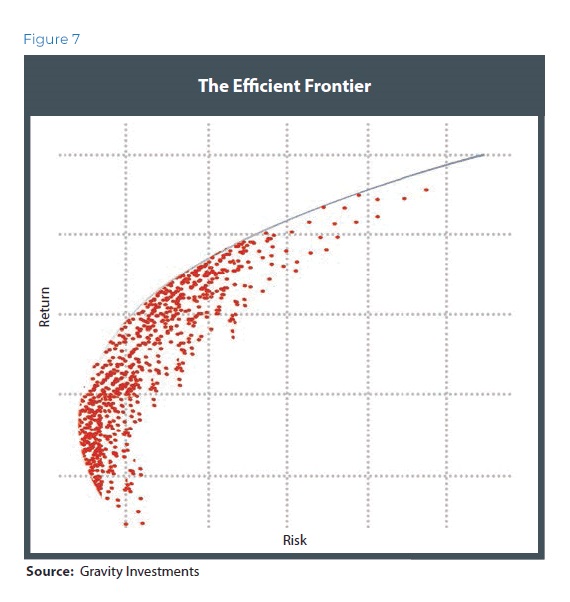
From this, we gather a point cloud of coordinate data and apply a convex hull about that point cloud. The hull is similar to the efficient frontier, except instead of 2-D it is 3-D, and the concept of efficiency is not mean-variance efficient, but diversification-utility efficient. Vector angles and lengths give the coordinates for the point cloud that creates the diversification frontier (Figure 4).

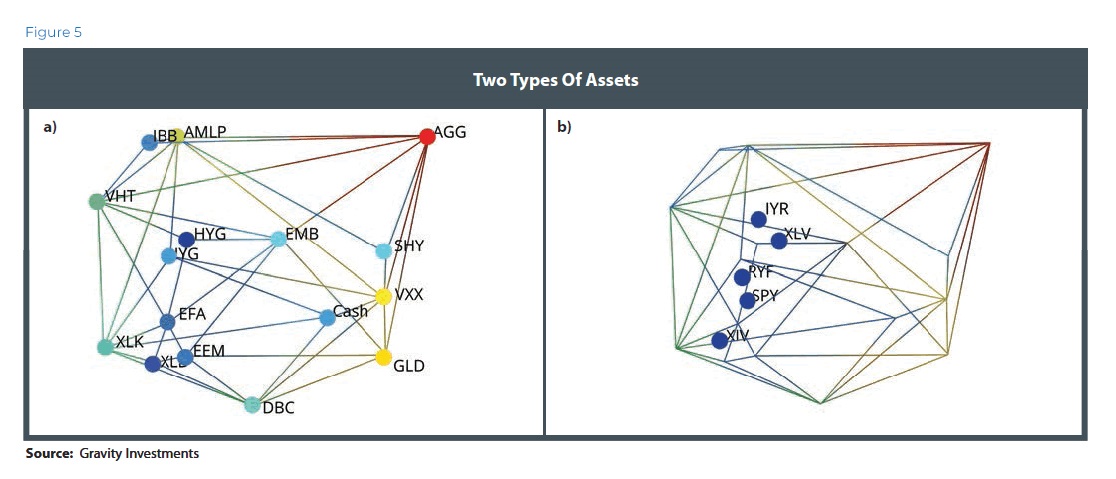
As Figure 5 shows, there are two types of assets: those that combine to create the frame (a) and those trapped inside (b). Efficient assets grow the portfolio in their respective directions. The interior assets are doing an inefficient job of growing the portfolios in their respective direction and are dominated by the assets comprising the diversification frontier. Interior assets are inefficient and normally discarded unless subject to a constraint.

ptt-joi-figure4
ptt-joi-figure5
While the 3-D graphics are useful for understanding the structure of the portfolio, the allocation mathematics may take place in a higher-dimensional space. Geometric principles of angles, lengths, convex hulls and volumes work in any dimension. As a result, the higher the dimensionality of the space, the more inclusive the allocation to marginally efficient assets.

When we model the asset vectors with all-equal lengths, the resulting portfolio is maximizing diversification. Every asset is assured a spot on the efficient frame, and the asset’s weight is exactly proportionate to the asset’s relative uniqueness.

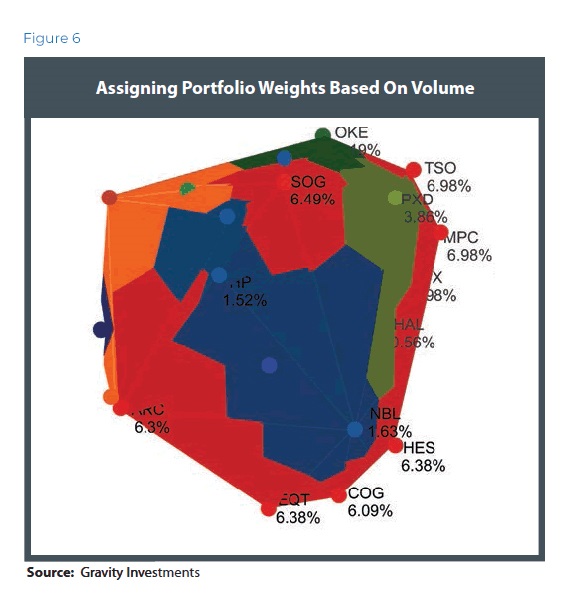
Now that the portfolio has a tangible body, we compute the volume and assign weights to every asset based on the pro rata volume contribution. The equation is simple: Volume = Money (Figure 6).

When we calculate the volume attributed to every asset, we are calculating the amount of capital that is optimally allocated to those assets in accordance with diversification and utility.

Highly correlated assets crowd one another out fighting for the space in the portfolio. Such highly correlated assets are also—intuitively— increasingly sensitive to small differences in their utility function, whereas a more uncorrelated asset in an otherwise-correlated portfolio will be rather insensitive to changes in that asset’s utility function. If one could find a historically negatively correlated asset, then it too would be relatively insensitive to the magnitude of its utility, if it had positive utility.

ptt-joi-figure6
ptt-joi-figure7
ptt-joi-figure8
ptt-joi-figure9
The origin of the model is cash. More specifically, it is a hurdle rate that any risky investment would have to outperform to warrant consideration into the portfolio. As such, increased cash holdings are warranted in more concentrated portfolios. Cash is a drag on a well-rounded portfolio. For every potential direction in the market, a balanced portfolio contains assets with greater utility than just cash.

Diversification Weighted 500:
Performance Refinements

Here we explore some of the specific estimation techniques we have applied to the research presented. Such estimation techniques, researched over the years, represent our baseline of best practices, learned and refined from our days as a software company. We were deliberate in our attempt to balance the simplicity of the rules applied, with the robustness of the process, the applicability to diverse strategies and the final performance.
ptt-diversification-dashboard-image
ptt-list-point1

Collect the historical index component data that were in the index (S&P 500) at the start of the observation period. The data source includes delisted assets to eliminate survivorship bias.

ptt-list-point2
Apply any allocation constraints and apply the investment policy to the portfolio. This fixed set of policies generates the capital market assumptions and includes data sampling, econometrics and investor preferences.
ptt-list-point3
Compute the optimization (vector mapping, scaling and volumes) to obtain the allocation weights and walk forward the test for the ensuing one-year period.
ptt-list-point4
Export the computed return series and adjoin with that of other periods to create a continuous-return time series for each sector.
ptt-list-point5
Repeat this process for each sector and period. Take the Diversification Weighted sector composites and optimize those using the same process to create the DW 500.

Investment Policies

Investment policies are the gearbox of the optimization engine. Historical data needs to be reshaped and refined to maximize its predictive efficacy. These refinements are designed to produce more accurate estimated inputs. Numerous techniques exist to estimate risk, return and correlation inputs. These are the required inputs of mean-variance optimization. Diversification Optimization shares the same inputs. Following are a few things we did to improve the predictions.
For this research, we use a Sortino ratio as our utility function in which the ratio denominator is a semivariance statistic, akin to downside deviation. We believe that downside deviation better matches ex-ante risk estimation with ex-post risk observation.

For each optimization’s anniversary date on Aug. 1, we would select two sample periods for the historical data. The first sample period was the previous one year; the second sample period was the previous 10-year period. The baseline risk, return and correlation values are calculated for every asset as the average of these two periods. We believe these two periods merge a positive predictive momentum signal arising from the one-year data with the stock’s performance over at least one full market cycle in the long sample. We tested staggered multiple optimization intervals and found no material effect. We applied the sampling procedure uniformly over all sectors and years.

In this research, and in accordance with our best practice methodologies, we apply a James-Stein shrinkage (Stein, 1961) process to the multisampled historical risk and return data. This process, applied uniquely to both risk and return, allows the portfolio architect to think of risk, return and diversification as three separate dials in the portfolio construction process. This allows you to weight risk and return data in their proper proportions. The more shrinkage that is applied to a return value, the more normalized the range of return. As such, it diminishes the role of returns in the optimization when compared to diversification or the chosen risk metric. Likewise, the same result comes if the risk value is shrunk more. In this research, we shrunk the risk values with a slightly higher coefficient than the returns values, effectively—albeit slightly—deprioritizing the assets’ semi-variance when compared to the estimated returns.
ptt-joi-figure10
In the DW 500 Index, we apply a filter called “semicorrelations” on the time series used to calculate correlations in an attempt to create downside diversification and allow upside unification. Since the point of diversification is to create portfolios with better performance— just like downside deviation—downside diversification helps tilt the portfolio to be aerodynamic on the upside and resistant in turbulent or downmarkets.

We designate the optimization dimension for each portfolio in an effort to attain a comfortable balancing point between systematic and idiosyncratic diversification. We were also cognizant to set the value high enough that it would more fully allocate to the natural diversification derived from the process and to minimize the application of the constraints. Optimizations taking place in lower dimensions better diversify the portfolio from a perspective of systematic influence, and optimizations taking place in higher-dimensional space more effectively diversify the portfolio from an idiosyncratic perspective.

We used the rule that the optimization dimension is equal to the square root of the quantity of investment options. For example, the telecom sector, having only 11 assets, was optimized in a three-dimensional space, while the 83 assets in the consumer discretionary sector were optimized in a nine-dimensional space.

We apply constraints to all assets. An asset constraint was set at 3 * 1/N (N = Asset Count). For a sector with 20 stocks, N is 5 percent, and the maximum constraint is 15 percent. We applied a similar minimum constraint. While these constraints denied the performance test, the benefit of the diversification/utility efficiency logic, the constraints ensured an allocation to all 500 stocks, creating a more relevant comparison focused on the weighting approach and less on the logic of diversification efficiency.

Contrast To Other
Weighting Approaches

Our performance evaluation will include comparisons to many popular weighting approaches, including:
5

Diversification Weighted

5

Equal Weighted

5

Fundamental Weighted

5

Market Cap

5

Revenue Weighted

5

Earnings Weighted

5

Volatility Weighted

We will limit the analysis in this section to risk-based strategies, as investors may more easily confuse risk with diversification. When we talk about risk-based strategies, we are including low volatility, minimum volatility, mean-variance optimization and risk party.

Funds of this ilk have seen recent success both in performance and garnering new assets. Now, 16 ETFs collectively manage $16 billion in funds from a strategy that did not exist before 2004. As the nature of indexation becomes more complex, the ETF market is now more accepting of smart-beta strategies. This will likely continue, but when put in context with the $2 trillion of global capital Markowitz estimated as being managed in accord with mean-variance optimization (Markowitz, private conversation, 2010), one can see the ETF space is nascent in its adoption of more complex systematic index products.
ptt-joi-figure11a
ptt-joi-figure11b
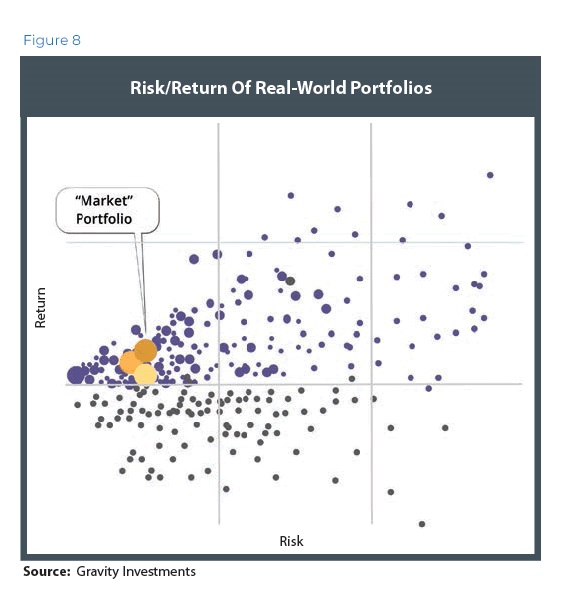
Figure 8 shows what happens as real-world portfolios from macroaxis.com are graphed using the actual risk and return values obtained: The positive association of risk and return is no longer apparent. The ex-ante relationship vanishes ex-post.

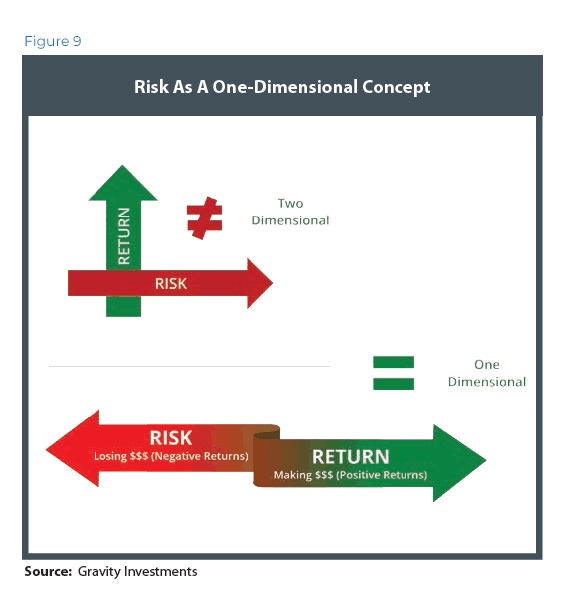
Fundamentally, risk and return are not two separate things, but the same. Risk is simply negative returns (Figure 9).

This foundational tenet is always obvious to investors in retrospect. Nevertheless, there are widespread errors in risk estimation, definition and application across the entire industry. Risk cannot be known in advance; it must be estimated. In a risk-based weighting scheme, any such estimation faces an impossible task of measuring the known unknowns and the unknown unknowns. One may liken risk measurement to holding a tape measure around a black hole without succumbing to the event horizon.

There may be some salvage value in risk minimization, certainly from diversification, but also from simple avoidance of the riskiest elements of the market. The most volatile decile of the Russell 1000 constituents underperformed the full index in the subsequent year by 8.52 percent for the period 1972 to 2012 (Ghayur, 2013).

One of the traditional methods of portfolio optimization and construction is mean-variance optimization (MVO), which was pioneered by Harry Markowitz in the 1950s (Markowitz, 1952). Markowitz and the variations he has spawned have had significant application in our industry, but they have only recently gained traction as index construction methodologies.

ptt-joi-figure11a-img
There may be some salvage value in risk minimization, certainly from diversification, but also from simple avoidance of the riskiest elements of the market. The most volatile decile of the Russell 1000 constituents underperformed the full index in the subsequent year by 8.52 percent for the period 1972 to 2012 (Ghayur, 2013).

One of the traditional methods of portfolio optimization and construction is mean-variance optimization (MVO), which was pioneered by Harry Markowitz in the 1950s (Markowitz, 1952). Markowitz and the variations he has spawned have had significant application in our industry, but they have only recently gained traction as index construction methodologies.

MVO’s focus on volatility fails to exploit an asymmetric diversification/return relationship (Damschroder, 2009). Furthermore, diversification is shown to have greater stability in a crisis (Damschroder, 2009).

ptt-joi-figure13

Performance Analysis

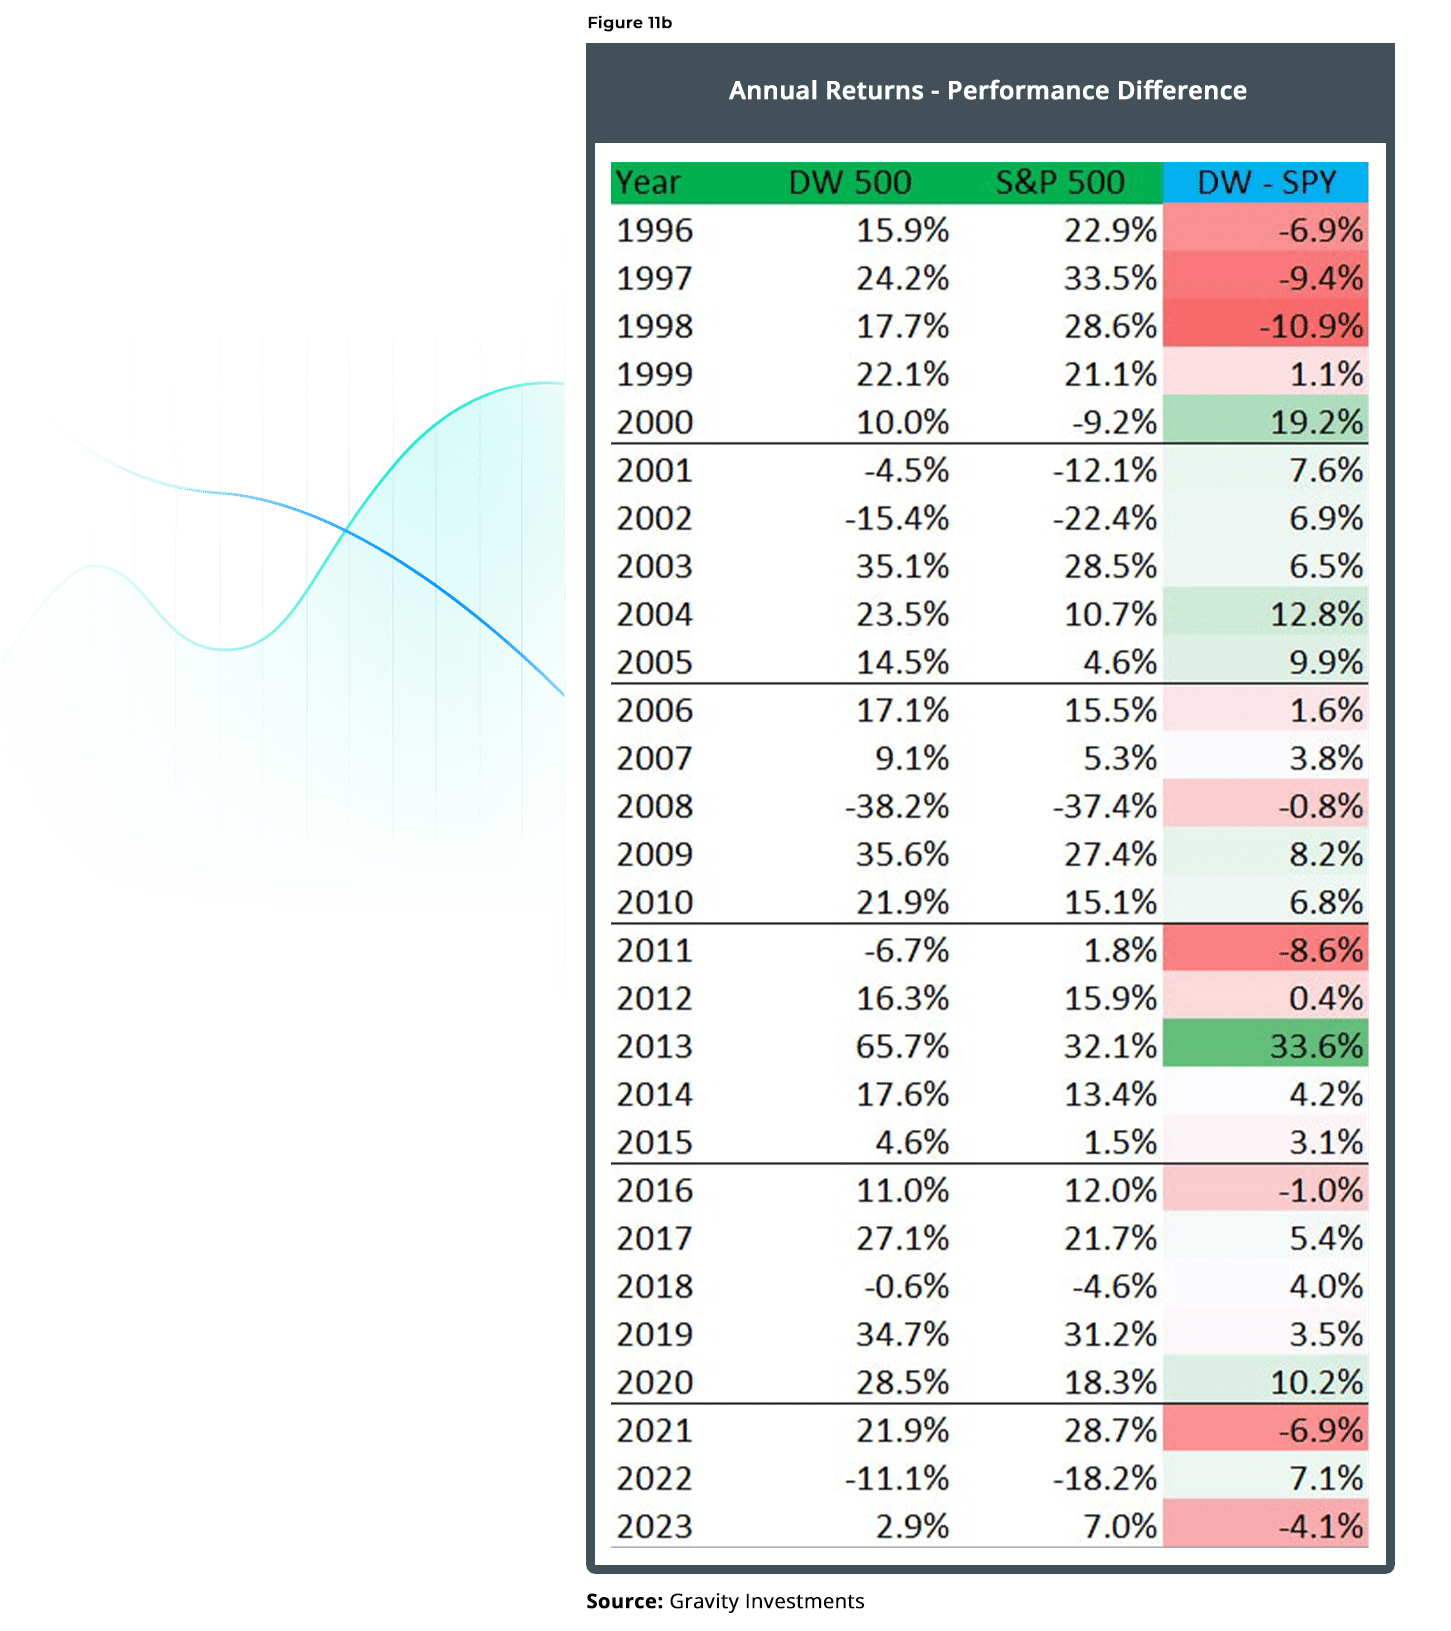
In aggregate, the Diversification Weighted 500 outperformed the S&P 500 index by 427 basis points per year (Figures 10 and 11). The Diversification Weighted strategy is reported net of fees, estimated at 90 bps and net of an estimated 20 bp trading cost.

Diversification looks to have had its worst relative year in 1998, despite putting up a 17.7 percent return. In calendar year 2008, DW was 80 bps under the S&P 500 Index despite having a few percent better drawdown through the crisis. While over the entire crisis the DW strategy did better, it also had a worse losing month, losing 3.43 percent more than the S&P 500 in October 2008.

The full-sample upside- and downside-capture statistics for the DW 500 are:
Up Capture : 105 percent Down Capture : 87 percent

To the surprise of many investors, diversification (at least intra-asset class) is not the panacea hoped for during market crises. The benefit of diversification is subtle, yet so consistent, that its effects are substantial, much like gravity.

Clearly, the performance looks good against a capitalization- weighted approach. What about other weighting approaches?
(See Figure 12.)

The equal-weighted and fundamentally weighted strategies are reported gross of fees and trading cost. The remaining assets are based on the ETF products, which report net fees. Dividends are reinvested. Before 2010, the DW 500 sectors and sector comparisons have their daily returns adjusted to receive the S&P 500 annual dividend yield (http://www.multpl.com/).

Risk Analysis

A few weighting approaches were excluded from the risk table in Figure 13, as the maximum drawdown statistic requires comparable histories for accurate comparison, and risk stats for any product having not lived through the crisis of 2008 seem trite.

To the chagrin of efficient market theorists, the Diversification Weighted strategies in most cases produce higher returns while lowering the portfolio variance. This hypothesizes massive market inefficiency, perhaps induced by the trillions of dollars attached to capitalization-weighted approaches.

When observed over the full 18.8-year analysis, we can observe risk and return together:
5

5 sectors with greater return and less variance

5

4 sectors with greater returns and more variance

5

1 sector with smaller returns and less variance

In Figure 14, the size of the bubble represents the relative weighting to the index.
ptt-joi-figure14

Diversification Returns &
Diversification Alpha

Diversification goes both ways. Most investors intuit the benefit of defensive diversification, but diversification can play offense, too. The defensive ability of diversification to protect capital is a function of the noncorrelation and is available to all investors in any strategy. Diversification as a proactive strategy is comparable to a rebalancing bonus. The sum of the defensive and offensive performance capabilities of diversification is what we call the “Diversification Alpha.”

The alpha is made possible by exploiting diversification, volatility and some sort of trading activity, such as rebalancing, but it can be other activity such as reconstitution or reoptimization. This trilogy of portfolio variables combines the idiosyncratic asset volatilities to produce alpha.

More rebalancing, more diversification (noncorrelation) and—contrary to modern portfolio theory—more volatility, are all catalysts to increase this level of alpha. The effect is a veritable profit ratchet, which relates to Parrondo’s paradox (Stutzer, 2010). This strategy is implemented at some large investment managers such as Parametric and Janus Intech. Our index construction technique enables a more efficient capture of the diversification-ratchet due to the optimization’s direct focus on diversification.

The diversification-ratchet is very similar to a rebalancing bonus; however, the diversification-ratchet is a more appropriate moniker because the alpha is available to investors without rebalancing. Other forms of portfolio activity produce the alpha, including reconstitution, reoptimization, profit-taking, stop loss, trimming and even dollar cost averaging. In all cases, the alpha requires diversification. In this research, we had annual reconstitution and annual reoptimization, no rebalancing and the strategy was able to benefit from the diversification-ratchet.

Portfolio managers get the defensive contribution of diversification whether or not they try to. The driver is the amount of noncorrelation exploited. In Diversification Returns and Asset Contributions, Fama and Booth (Booth, 1992) coined the term “diversification returns,” which represents an additive portfolio return attributed to diversification. Booth and Fama approximated this as half the variance reduction in the portfolio given by diversification. The weighted average asset variance would be the portfolio variance if the correlations were all 1. For the most recent Diversification Weighted 500, the weighted average asset variance is 9.35, corresponding to a standard deviation of 30.57 percent. The portfolio variance is 3.41 percent, corresponding to a standard deviation of 11.64 percent.
The difference in variances—5.94 percent when halved—provides a 2.97 percent annual diversification defensive return.
As this shows, the incremental return is a function of the amount of variance reduction; it is not a function of the actual level of the portfolio variance. For example, if you start with low-volatility assets, say, having a weighted average standard deviation of 9 percent, the covariances in the portfolio serve to further reduce the portfolio standard deviation to 8 percent. The diversification return is (.09−.08)2 = .857 percent. While the portfolio may claim a low variance, the diversification return of 86 bps is a fraction of the 297 bp diversification return obtained by the DW 500. If your focus is variance and not correlation, it limits the amount of variance reduction, and thus the Diversification Alpha.
ptt-joi-figure16

Stacking Diversification

The Diversification Weighted 500 and this article are introducing the idea of a stacked rebalancing bonus. Diversification may be woven in at multiple levels in a portfolio. By stacking the Diversification Alpha at multiple levels, it is possible to produce a purely additive performance gain. This research demonstrates the effect by optimizing within each sector and optimizing the sectors again for the composite.
ptt-joi-figure10
ptt-joi-figure18
Each level of the alpha stack can be subject to smart tunings of the optimization inputs designed to better match and harmonize with momentum and mean-reversion cycles specific to the underlying index components.
In Figure 15, the Diversification Alpha is larger at the security level due to the higher volatility and lower correlations of the individual securities.
While beyond the scope of this research, it would seem to be further possible (and likely) for a third alpha stack working at an asset class and/or country level.

Sector Analysis

In Figure 16, each of the line-graphs represents the relative performance of the Diversification Weighted sector and composite indexes with regard to their cap-weighted counterparts. Only the industrials sector underperformed. Curiously, the Diversification Weighted technology sector showed material underperformance during the late 1990s. When a market-leading sector or industry arises, we have seen the worst available correlations come from that leading sector. As a result, unless otherwise neutralized by stronger expected performance, it is the diversification process’ natural tendency to underweight the market leader segment.

Figure 17 includes a stacked chart to help illustrate the consistency of the incremental performance for each sector over time.

The sector allocation also reveals an interesting and intuitive dynamic: Whenever the market heats up, asset correlations tend to come in, leaving the investor with relatively fewer diversification sources. Telecom and utilities are the largest active weights of the Diversification Weighted strategy over the whole period.

We observe in Figure 18 that allocations to these less alluring sectors have increased going into a market peak. These investments have acted as an automatic buttress to the portfolio-elevated systematic risk. This underscores an interesting behavioral tenet: Diversification, systematically applied, works as a check on emotional overreactions, and is a way of imposing systematic and sound investment discipline into the strategy.

Investors in a Diversification Weighted strategy seem to enjoy a fair amount of consistency in performance. The relative consistency of the sector weights over time are a positive indicator of turnover control. Consistency appears both over time and across the sectors. The Diversification Weighted 500 sector-sleeves beat their benchmark in nine of 10 instances (Figure 19).

MPT And Factor Analysis

The DW 500 shows an R2 of .80 to a single factor market risk, and a R2 of .83 to a five-factor model. It had statistically insignificant factor exposures to size, momentum and the risk-free rate. The value factor gave a positive exposure, with a coefficient of .23. For the analysis period, value paid investors 2.09 percent annually, which boosted the returns to the DW 500 by 49 basis points. We expect this is an artifact of the focus on diversification.
Value companies by their nature have a greater proportion of idiosyncratic performance, when compared to growth, which often shares homogenizing factors, such as cyclicality (data is from Ken French website (French, 2014)).
Crucially, the Diversification Weighted 500 produced 652 bps of alpha per year on average for more than 18 years. The alpha for the five-factor model is 414 bps. The statistical significance of the beta-factor alpha is observed having a P value of .00014, or a chance of the alpha being obtained randomly less than 1 in 7,000.

Remarkably, the alpha was demonstrated purely by the weighting approach, as the product had naive security selection, no timing, leverage, shorting, hedging or other positional risk management, and invested in all the same underlying components of the benchmark.

ptt-diversification-sector-vs-benchmark

Attribution Analysis

The full-period attribution analysis shows that the Diversification Weighted 500 actually lost 274 bps compared to ending sector weights.

This means that the alpha produced by the strategy did so with a 274 bp head wind at the sector level.

Sustainability And Capacity

Diversification Weighting carries with it a theme of sustainability not found in any other weighting scheme except Fundamental weighting. A weighting scheme is an allocation scheme, and an allocation scheme inherently matches providers of capital (investors) with demanders of capital (companies). Diversification lives in the crevices of finance. Any two mega-cap companies are globally interwoven into the mesh that buoys the correlation of the two and decreases their diversification potential. Value companies have a greater proportion of idiosyncratic risk, and thus tend to enjoy lower correlations compared with growth companies. Imagine a world where capital formation is free of the massive head winds of regulation and scale, afforded to a few thousand public companies that can shoulder such overhead. The correlation of entrepreneurs, ideas and execution provides an infinite pool of diversification sources, and we hope that Diversification Optimization drives capital in the most beneficial way.
Is the world ready to put trillions of dollars into Diversification Weighted strategies? What about capacity constraints? Will the alpha erode with assets? Naturally, expected returns and other assumptions vary greatly from investor to investor.

You can imagine that diverse investor expectations across strategies and platforms may help alleviate matters of moving the market. Whether the DW 500 or another DW strategy—be it equity, asset allocation, currency, fixed income or funds of funds—Diversification Weighted models may likely continue to perform as the massive macro inefficiencies induced by behavioral volatility (overreaction), and passive capitalization approaches appear to provide plenty of ammunition capable of sustaining the performance of Diversification Weighted strategies into the future.

Conclusion

Since January 1996, the Diversification Weighted 500 Index strategy posted a net annual return of 12.40 percent, which bested all other weighting approaches including capitalization weighting by 427 bps annually. Risk levels were comparable but slightly less.

The Diversification Weighted 500 demonstrates material and consistent outperformance against other weighting approaches and within the sectors sleeves that we consolidated into the composite.

We explain a framework for diversification measurement and optimization. Diversification Optimization builds on this framework, and the results contrast favorably versus other weighting approaches. We quantify the Diversification Return at 2.97 percent, and we introduce the Diversification Alpha. Total alpha for the strategy is 652 bps annually for over 18 years. We further introduce the ability to stack the Diversification Alpha at the security, sector and asset class level.

The flexibility and efficacy of Diversification Optimization, combined with the demonstrated consistency, attractive risk metrics and total return, presents a strong case for the institutional application of Diversification Weighting as an overlay weighting strategy, product-sleeve, core-satellite model or index.

Disclosure

This portfolio is hypothetical. This is a historical simulation of the portfolio performance an investor would have obtained had you invested in the same selections at the beginning of the simulation. This report provides information on how the portfolio holdings would have changed and would have performed for a certain period.
We have strived to reduce or eliminate potential biases in the process to provide the most accurate assessment of the performance prospects of the strategy. Because Portfolio ThinkTank offers a significant However, it may not be possible for any historical simulation to completely ensure it is free of all biases.
Please see https://portfoliothinktank.com/the-gold-standard-for-portfolio-backtesting/ and https://portfoliothinktank.com/the-seven-deadly-sins-of-portfolio-backtesting/ for a more complete understanding of biases and risks when backtesting portfolio strategies.
Backtested strategies also run the risk of cherry picking. Cherry Picking is when the author of the backtest has created many variations and is presenting one of the variations that is more favorable. This research was not produced in whole or in part by cherry picking.
This simulation is based on an account with tax exempt or tax deferred growth. Taxable accounts will have to pay the appropriate taxes for dividends, interest and capital gains, which will decrease the performance depicted.
This simulation is not based on actual trading accounts or account composites which may or may not exist for this strategy and may be materially different including worse than the performance illustrated above. Past performance is not necessarily indicative of future performance. Performance results including risk, return and diversification measures are not guaranteed to persist in the future.

This historical performance simulation has been adjusted to reflect estimated management fees.
The suitability of this portfolio strategy requires that you have thoughtfully and accurately completed your investor objectives from your accounts’ Investment Policy Statement. https://portfoliothinktank.com/portfolio-think-tank-login/
Diversification strategies alone cannot assure a successful investment outcome. Strategies offering greater diversification cannot guarantee any reduction in loss of capital.
Your ability to follow this investment strategy is a risk. Investors often dispose of successful strategies at inopportune times thus turning potentially profitable strategies into losses.
Portfolio data is taken from sources believed to be accurate, however, there is no warranty or guarantee as to the accuracy or completeness of data and statistical calculations thereupon. Our performance results are not audited or otherwise approved by any regulatory agency. We regularly perform quality and accurate tests on our calculation and algorithmic procedures. Portfolio ThinkTank does not furnish investment advice without an investment advisory agreement.
The period of time selected for analysis may have a significant bearing on the relative attractiveness of the strategy and the strategy versus another portfolio or benchmark. The author of the strategy controls the default period of time used to analyze performance and from there, users may select any desired period of time from the menu. In general, longer periods, greater diversification and lower concentrations of holdings result in more credible, more persistent performance.
We are unaware of any errors at the time of writing.

Certain methodologies described in this paper are protected by U.S Patents 8,156,030 & 7,472,084.

References

http://www.multpl.com/. (2014).
Booth, David and Eugene Fama. (May/June 1992). “Diversification Returns and Asset Contributions.” Financial Analysts Journal, vol. 48, No. 3, 26-32.
Damschroder, James. (2010). Internal research report.
Damschroder, James. (2014). “Systematic Risk Exposure of Weighting Approaches,” working paper.
Damschroder, James and Haoyan Sun. (2009). “How True Diversification Preserves Capital.”
French, Kenneth. (2014). Data Library. Retrieved from Darthmouth: http://mba.tuck.dartmouth.edu/pages/faculty/ken.french/data_library.html.
Ghayur, Khalid (2013). “Low Volatility Investing.” Burridge Center Conference at the University of Colorado, Boulder.
Markowitz, H. (March 1952). “Portfolio Selection.” The Journal of Finance, vol. 7, No. 1, 77-91.
Markowitz, H. (July 2010). private conversation. (James Damschroder, interviewer)
Stein, Charles and W. James. (1961). “Estimation with Quadratic Loss.” Fourth Berkeley Symposium. Berkeley, California.
Stutzer, Michael (Spring 2010). “The Paradox of Diversification.” Journal of Investing, vol. 19, No. 1, 32-35.
Swensen, David. (2005). “Unconventional Success.”